Musical Spectrum Analysis
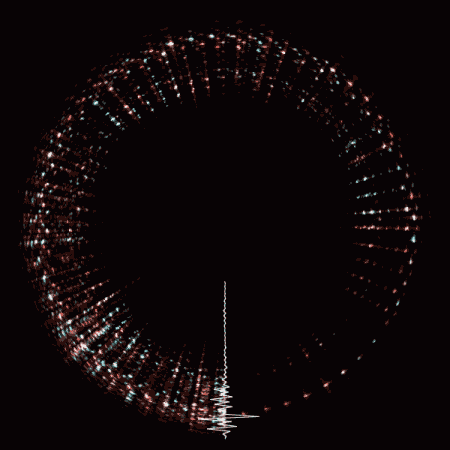
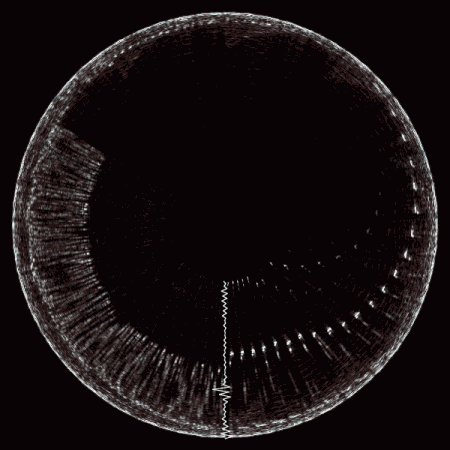
Musical Spectrum Analysis is a really interesting take on Spectrograms. Developed by Jon-Kyle Mohr, a designer/programmer/musician and member of the Cargo Collective team, and Lee Martin, a developer at SoundCloud, who built a generative incarnation with Canvas and the SoundCloud API, which can be located at spectrogr.am.
What you are observing above is basically this (as described by Jon-Kyle Mohr):
Sound frequencies are displayed as they are heard. Lower frequencies are mapped low (bottom) to high (top). Brightness is determined by amplitude.
Sweeping tones and rhythmic patterns create intricate structures. The circular form is in memorial of dead formats; the CD, MiniDisc and others. R.I.P.
Andrew Ohlman, who also happens to be a member of the Cargo Collective team, compiled a Quartz sketch which does similar things called Circular Spectrogram.


You can download the Circular Spectrogram application here to create your own visuals (currently only available for Mac users).
Posted by B3PO
